
A couple days ago I noted that because Bitpay reuses its addresses, it is possible to monitor them and that there hasn’t been much of a growth since May (the last time they announced numbers).
Today a redditor posted some visual analysis and explanation of these same Bitpay addresses. [Note: I’ve reached out to the user and will update this post if they provide any other information.] Below is their analysis:

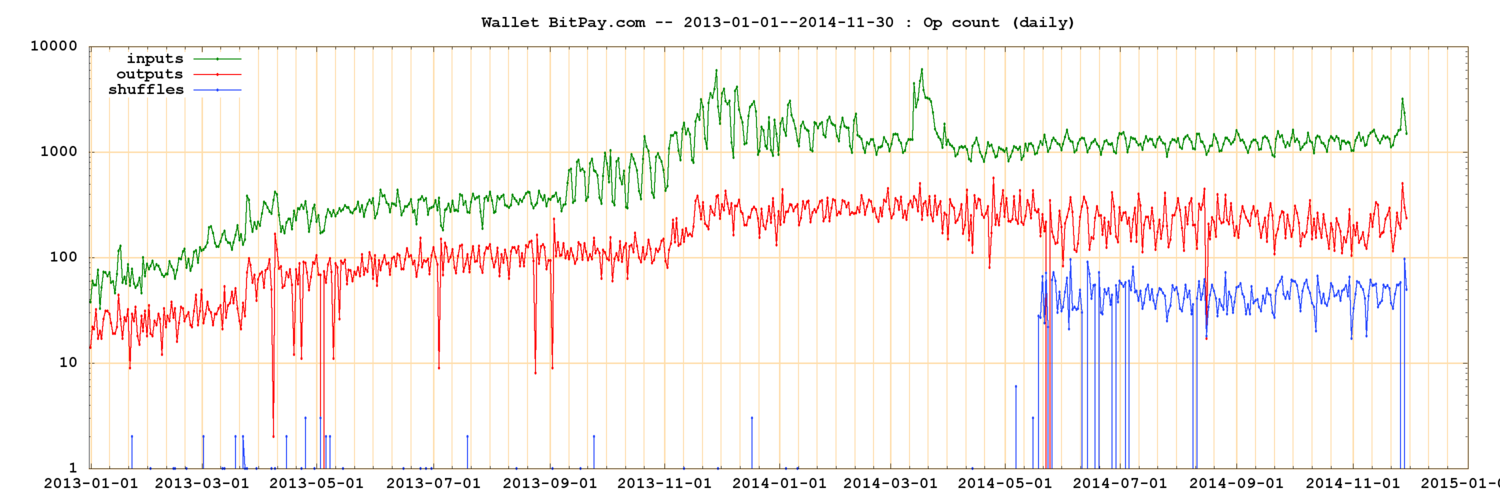
The green line on this graph shows the number of payments per day into the presumed (see below) receiving address of BitPay, from 2013-01-01 to 2014-11-3. Note that the vertical axis uses log scale. The number was about 1000–1500 per day through most of 2014, with a strong weekly pattern. The spike at the right end is Black Friday; there were about 3200 inputs, i.e. about 2x to 3x as many as in a typical day.

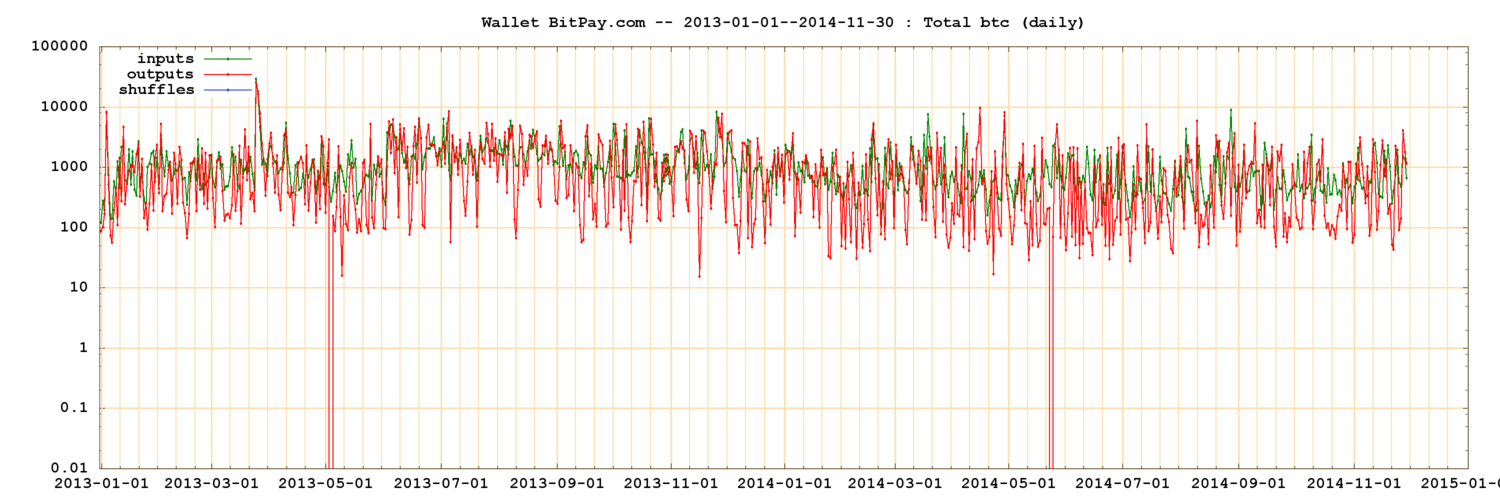
The green line on this graph shows the number of BTC deposited each day into that wallet. This graph is rather strange since the number is practically constant since January 2013, about 500–1000 BTC/day, and shows no weekly pattern. And no Black Friday spike either.
What happens is that there are two kinds of inputs to that wallet, which I will call “retail” and “wholesale” (although I have no idea what the latter are, really). The wholesale inputs are large (often hundreds of BTC) and have been regular in amount since 2013-01. The “retail” ones are much smaller (mostly under 10 BTC, many under 1 BTC), much more numerous, and have increased about 3x from mid-2013 to mid-2014. Hence the first graph above is dominated by the retail inputs, while the second graph basically shows the wholesale ones.
The data for these plots comes from these pages that are claimed to show all transactions into the BitPay receiving wallet since it was created. However, the addresses that make up that “wallet” were inferred from the blockchain by an undisclosed heuristic that is supposed to identify addresses belonging to the same owner.
My guess is that the heuristic simply assumes that two addresses that are inputs to the same transaction must belong to the same owner (since one needs both private keys to sign the transaction) and assigns them to the same “wallet”. If my guess is correct, the heuristic may fail to include in the “Bitpay.com wallet” some addresses that belong to BitPay but were never used together with the identified ones.
However, the volume of BTC that went into that heuristic “wallet” during May/2014 seems to match what BitPay said to process per day in that month (assuming that they picked the best day of May); so it seems that the heuristic wallet is fairly close to the real one.
Updated with more from the same user:
- BitPay now processes about 1000-1500 “retail” payments per day, averaging less than 1 BTC each;
- The number of retail transactions processed by BitPay has grown 3x since mid-2013, and has been flat through most of 2014;
- The amount of BTC processed by BitPay (including “retail” and “wholesale” payments) has been quite constant since Jan/2013, about 500-1000 BTC/day
- In terms of dollar value, the amount processed by BitPay (including “retail” and “wholesale” payments) has increased a lot from 2013 to 2014, but has fallen 50% or more since February, as the BTC price fell.
- Black Friday had a modest effect (2x to 3x) on the number of “retail” payments, but had no effect on the total BTC/day (which is dominated by the “wholesale” payments).
Share the post "Are there changes in the volume of retail transactions through Bitpay this past year?"
Pingback: Deliver liquidity, multiple ledgers at a time please | Edge Technology